

 Login
Login- Consulting
- Training
- Partners
- About Us
x
Cloud Computing
 5 Mins Read

 November 22, 2016
One of the common mistakes done by most of the professionals is not using valuable data called ‘Logs’. Because of the quantity of logs generated, the chances of using them becomes very less. Logs are used only to debug in case of failure or issues, but it can be used for much more
For Example:
The collections and analyzing of the log becomes extremely difficult because of the diversity generated. For example we have access logs, error logs, application logs etc. which are associated with an application or a server.
In this blog, I will be demonstrating how to install and configure ELK Stack.
ELK stands for: Elasticsearch, Logstash and Kibana.
Before we begin, let’s have a quick overview of the overall architecture with their components, followed by the implementation procedure.
Working:
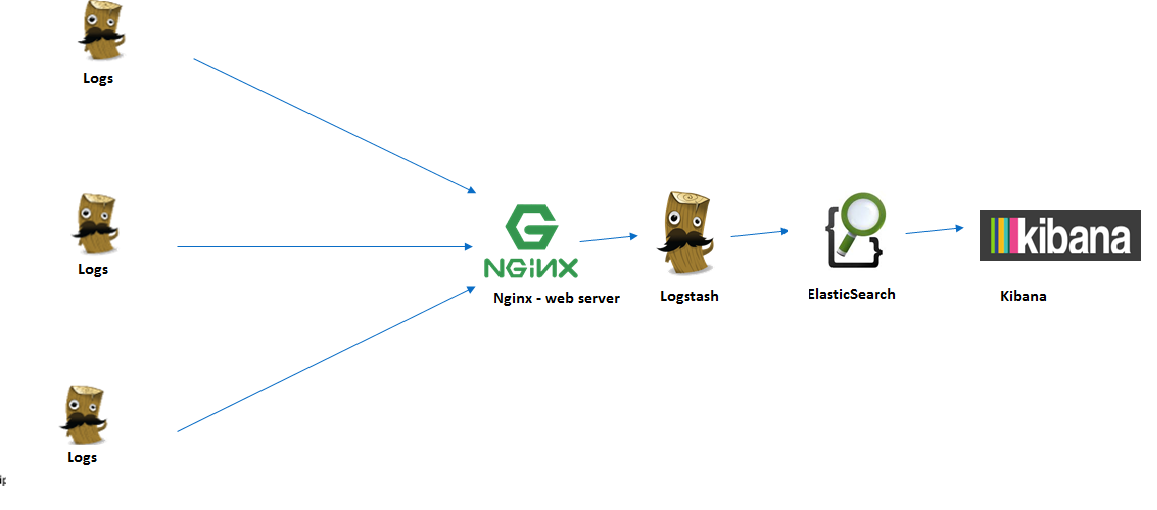
The ELK stack architecture is very simple and clearly specifies the flow of the process.Various logs from different locations will be pulled by the Logstash (If you install Nginx for allowing external access then the logs will go to Nginx first), it will process the logs.
Logstash is the center where all the logs are processed and differentiated. Logs are then pushed to ElasticSearch, which is a Retrieval engine, it will index all the logs as per index pattern and will store it to be further accessed by Kibana.
Kibana is a Web UI through which we will do all the activities such as visualizing and analyzing, creating index patterns, etc.
Prerequisites:
Step 1: Launching EC2 Instance and all Installations
Install Java 8
|
1 2 3 |
sudo add-apt-repository -y ppa:webupd8team/java sudo apt-get update sudo apt-get -y install oracle-java8-installer |
Install ElasticSearch
|
1 2 3 4 5 6 7 |
sudo wget -qO - https://packages.elastic.co/GPG-KEY elasticsearch | sudo apt-key add – echo "deb https://packages.elastic.co/elasticsearch/2.x/debian stable main" | sudo tee -a /etc/apt/sources.list.d/elasticsearch-2.x.list sudo apt-get update sudo apt-get -y install elasticsearch sudo service elasticsearch restart curl localhost:9200 sudo update-rc.d elasticsearch defaults 95 10 |
Install Logstash
|
1 2 3 4 5 6 |
echo "deb https://packages.elasticsearch.org/logstash/1.5/debian stable main" | sudo tee -a /etc/apt/sources.list sudo apt-get update sudo apt-get install logstash sudo update-rc.d logstash defaults 97 8 sudo service logstash start sudo service logstash status |
Install Kibana
|
1 2 3 4 5 6 7 8 9 |
wget https://download.elastic.co/kibana/kibana/kibana-4.1.1-linux-x64.tar.gz tar -xzf kibana-4.1.1-linux-x64.tar.gz cd kibana-4.1.1-linux-x64/ sudo mkdir -p /opt/kibana sudo mv kibana-4.1.1-linux-x64/* /opt/kibana cd /etc/init.d && sudo wget https://raw.githubusercontent.com/akabdog/scripts/master/kibana4_init -O kibana4 sudo chmod +x /etc/init.d/kibana4 sudo update-rc.d kibana4 defaults 96 9 sudo service kibana4 start |
Step 2: Configurations
Configure Logstash:
|
1 2 3 4 5 6 7 8 9 10 11 12 13 14 15 16 17 18 19 20 21 22 23 24 25 26 27 28 29 30 31 32 |
input { file { type => "syslog" path => [ "/var/log/messages", "/var/log/*.log","/var/log/httpd/access_log","/var/log/httpd/error_log" ] } } output { stdout { codec => rubydebug } if ([program] == "logstash" or [program] == "elasticsearch" or [program] == "nginx") and [environment] == "production" { elasticsearch { host => "localhost" index => "httpd-%{*}" } } else { elasticsearch { host => "localhost" # Use the internal IP of your Elasticsearch server for production }}} filter { if [type] == "syslog" { grok { match => { "message" => "%{SYSLOGTIMESTAMP:syslog_timestamp} %{SYSLOGHOST:syslog_hostname} %{COMBINEDAPACHELOG} %{DATA:syslog_program}(?:\[%{POSINT:sy$ add_field => [ "received_at", "%{@timestamp}" ] add_field => [ "received_from", "%{host}" ] } syslog_pri { } date { match => [ "syslog_timestamp", "MMM d HH:mm:ss", "MMM dd HH:mm:ss" ] }}} |
|
1 |
sudo service elasticsearch restart |
|
1 |
sudo service kibana4 restart |
|
1 |
sudo service logstash restart |
NOTE: This will make Kibana accessible to instance_ip only. If we want to allow external access, then need to use Nginx as reverse proxy.
To allow external access following are the steps to configure with Nginx
|
1 |
sudo service kibana4 restart |
|
1 |
sudo htpasswd -c /etc/nginx/htpasswd.users kibadmin |
This will prompt for a password that you will need to access Kibana dashboard along with kibadmin user
|
1 |
sudo vi /etc/nginx/sites-available/default |
|
1 2 3 4 5 6 7 8 9 10 11 12 13 14 |
server { listen 80; server_name example.com; auth_basic "Restricted Access"; auth_basic_user_file /etc/nginx/htpasswd.users; location / { proxy_pass https://localhost:5601; proxy_http_version 1.1; proxy_set_header Upgrade $http_upgrade; proxy_set_header Connection 'upgrade'; proxy_set_header Host $host; proxy_cache_bypass $http_upgrade; } } |
This configuration will make nginx to direct the server’s HTTP traffic to kibana which is listening on localhost:5601. This will enable to access kibana dashboard with elasticsearch server’s public ip.
Restart nginx to apply changes that we made
|
1 |
sudo service nginx restart |
Step 3: Access Kibana Dashboard

This is the dashboard that we will get.

In this way, we get the logs.But, there are many options to view logs in different formats and to filter them.

Here, you can see the logs of nginx. There are many such options on the Kibana dashboard that you can explore.
Implementing ELK Stack will provide you with the following benefits:
You just need to create index pattern as per your need and you are ready to go.
Feel free to ask your questions below and I will get back to you on them.
Need professional assistance or consulting services for your ELK Stack project? Kindly visit here Please comment and share if you liked the article.
SHARE


Case Study
By gopi
Apr 22, 2024


Big Data, Cloud Computing
By Pankaj Choudhary
Apr 19, 2024

Case Study
By gopi
Apr 16, 2024


Case Study
By gopi
Apr 16, 2024
Our support doesn't end here. We have monthly newsletters, study guides, practice questions, and more to assist you in upgrading your cloud career. Subscribe to get them all!
Comments